HOME
Consulting Services
Management ConsultingProduct Development
System Implementation
Wireless Site Surveys
Troubleshooting
Training
Expert Witness
What's New
Technical Resources
NewsletterBooks
Tutorials
Industry News
Quick Tips
Links
About Us
ConsultantsTechnology Focus
Industries Served
Our Clients
Client Testimonials
Contact Us
Follow Us:
How to: Define Minimum SNR Values
for Signal Coverage
by
Jim Geier
Back to Tutorials
When performing a RF site survey, it’s important to define the range boundary of an access point based on signal-to-noise (SNR) ratio, which is the signal level (in dBm) minus the noise level (in dBm). For example, a signal level of -53 dBm measured near an access point and typical noise level of -90 dBm yields a SNR of 37 dB, a healthy value for wireless LANs. Don’t let the unit “dB” throw you – it merely represents a difference in two logarithmic values, such as dBm.
SNR impacts performance
The SNR of an access point signal, measured at the user device, decreases as range to the user increases because the applicable free space loss between the user and the access point reduces signal level. The same goes for the signals propagating from the user device to the access point. An increase in RF interference from microwave ovens and cordless phones, which increases the noise level, also decreases SNR.
SNR directly impacts the performance of a wireless LAN connection. A higher SNR value means that the signal strength is stronger in relation to the noise levels, which allows higher data rates and fewer retransmissions – all of which offers better throughput. Of course the opposite is also true. A lower SNR requires wireless LAN devices to operate at lower data rates, which decreases throughput. A SNR of 30 dB, for example, may allow an 802.11g client radio and access point to communicate at 24 Mbps; whereas, a SNR of 15 dB may only provide for 6 Mbps.
Real-world values
My company, Wireless-Nets, has performed extensive testing of wireless LANs at various SNR levels. For instance, we’ve run user-oriented tests to determine the impacts of SNR values on the ability for a user with a typical client radio (set to 30 mW) to associate with an 802.11b/g access point and load a particular webpage. For various SNRs, the following is what we found for the signal strength (found in the Windows connection status), association status, and performance when loading a particular webpage from a wireless laptop. We measured the SNR value from the same laptop and client radio using AirMagnet Analyzer. To ensure accurate comparisons, we cleared the laptop’s cache before reloading the page:
> 40dB SNR = Excellent signal (5 bars); always associated; lightening fast.
25dB to 40dB SNR = Very good signal (3 - 4 bars); always associated; very fast.
15dB to 25dB SNR = Low signal (2 bars); always associated; usually fast.
10dB - 15dB SNR = Very low signal (1 bar); mostly associated; mostly slow.
5dB to 10dB SNR = No signal; not associated; no go.
These values seem consistent with testing we’ve done in the past, as well as what some of the vendors publish.
SNR recommendations
Based on this testing, we recommend using around 20dB as the minimum SNR for defining the range boundary of each 802.11b/g access point. That ensures a constant association with fairly good performance when performing typical network functions, such as web browsing and email synchronization. Keep in mind that 802.11n may require different range boundary definitions. If you plan to deploy voice over a wireless LAN, then you’ll likely need a higher minimum SNR. For example, Cisco recommends 25 dB for their wireless voice telephony systems. Also, a larger margin (i.e., higher SNR), may be necessary in some venues, especially where there is a great deal of multipath signal propagation, such as manufacturing plants and where airplanes park at airports. Keep in mind that the corresponding level of performance only occurs at the boundary of each access point. Users associating with access points at closer range will have higher SNR and better performance.
When measuring SNRs, use the same client radio and antenna as the users will have if possible. A variance in antenna gain between the survey equipment and user device, for example, will likely result in users having a different SNR (and performance) than what you measured during the survey. Also, some client radios have better transmit power and receive sensitivity than others, which can throw off your results if you don’t use the same client radio as the users will have.
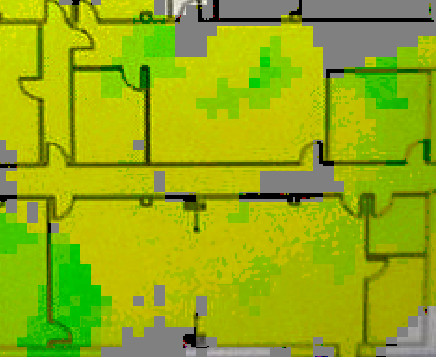
Changes made in the facility, such as the addition of walls and movement of large boxes will affect SNR too. Thus, it’s generally a good idea to recheck the SNR from time-to-time, even after the network is operational. This can be done easily with commercially-available tools. For example, the figure below is a screenshot taken from AirMagnet Survey, with the green and yellow colors indicating acceptable signal coverage areas of an 802.11g network with the tool set to a range boundary of 20 dB. If you find that the SNR is below the minimum value in some areas, such as the gray-shaded areas in the figure, consider installing additional access points or moving existing ones better distribute the signals and fill in the holes.
Concluding thoughts
The use of a particular SNR value as a requirement for signal coverage is certainly a good practice, and the rules of thumb given in this tutorial are a good starting point. Be sure, however, to perform testing in your own environment to determine acceptable range boundary definitions. Before making the system operational, always perform thorough verification testing of the applications, such as web browsing, email, and voice telephony, using typical client devices and radios that will actually utilize the network. This provides reassurance that the system will indeed satisfy coverage and performance requirements.
Questions? <<Contact the Author>>
Back to Tutorials